Analytics are accessible for both the desktop/web and mobile versions of CircleLoop, providing a comprehensive overview of call activity within your organisation.
Additionally, users have the option to download reports containing this data.
Analytics on Desktop & Web App
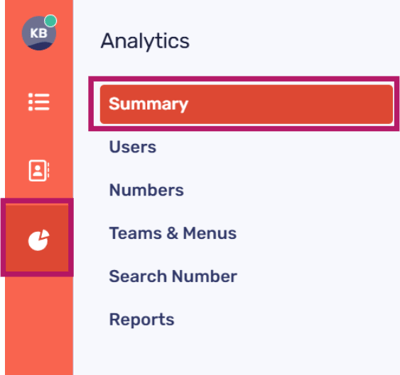
To access the Analytics screen on your desktop, simply click the pie chart icon located on the left-hand side.
You can easily filter your analytics results by clicking on the options provided here:
-
Summary - An overview summarising your Total, Inbound, Outbound, and Missed calls
-
Users - You can view a comprehensive list of all CircleLoop users within your organisation, along with their total call statistics, including Inbound, Outbound, and Missed calls. By clicking on a specific user, you can access detailed statistics that pertain to that individual
-
Numbers - Here you can see Total Calls, Inbound, Outbound and Missed calls in order of number
-
Teams & Menus - Total Calls, Inbound, Outbound and Missed calls in order of Team or Menu
-
Search number - To access data associated with a specific number, please enter it here. This functionality is designed for both CircleLoop users and external callers. Remember to add the area code when inputting a number here!
Please note that information returned for standard users will be for that user only; they will not be able to see information about other company users.
Reports are not available for standard users and will only show for administrators.
The 'Summary' graph and selecting a graph view
Your 'Summary' data can be visualised through a graph, as illustrated below. This information is formed from all call data sources within your organisation.
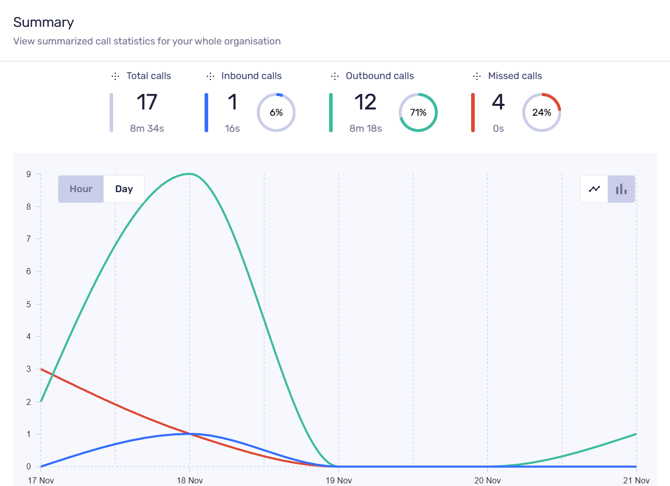

You can refine this information by selecting either 'Hour' or 'Day' through the corresponding icons on the graph.
The icons located in the top right corner of the graph area enable you to toggle between two available views: a line graph (as shown above) and a bar chart.
Hover over the graph area to view details of:
-
Inbound calls (blue)
-
Outbound calls (green); And/or
-
Missed calls (orange).
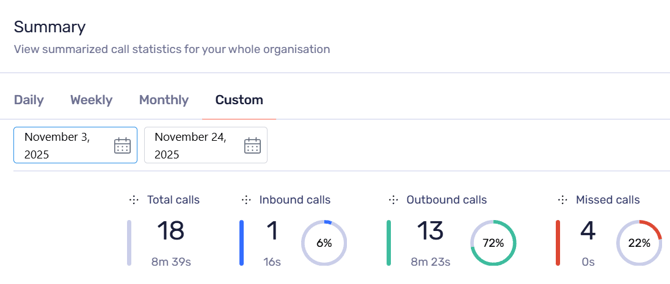
Filtering your graph data
Use the filters above your graph area to narrow down your data search by daily, weekly, monthly, or by providing a custom date range (as shown below).
These filters are available for summary, users, numbers, Teams and Menus.

Analytics on mobile
Mobile device analytics deliver the same data as is shown on desktop versions, albeit with a different presentation.
Tap on the Analytics pie chart icon at the bottom of the screen to get started.
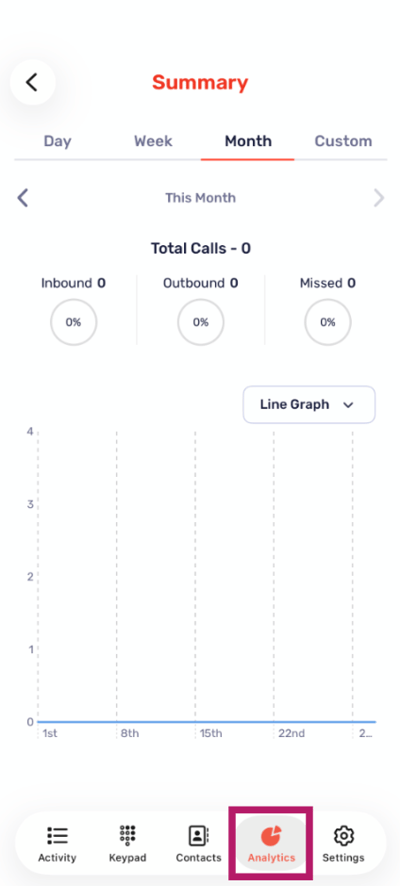

You can easily filter your analytics results by tapping on the options provided here:
-
Summary - An overview summarising your Total, Inbound, Outbound, and Missed calls
-
Users - You can view a comprehensive list of all CircleLoop users within your organisation, along with their total call statistics, including Inbound, Outbound, and Missed calls. By clicking on a specific user, you can access detailed statistics that pertain to that individual
-
Numbers - Here you can see Total Calls, Inbound, Outbound and Missed calls in order of number
-
Teams & Menus - Total Calls, Inbound, Outbound and Missed calls in order of Team or Menu
Please note that the ‘Search number’ option is not currently available for mobile versions of PhoneLine+.
Filtering your graph data
Use the filters above your graph area to narrow down your data search by daily, weekly, monthly, or by providing a custom date range (as shown below).
These filters are available for summary, users, numbers, Teams and Menus.
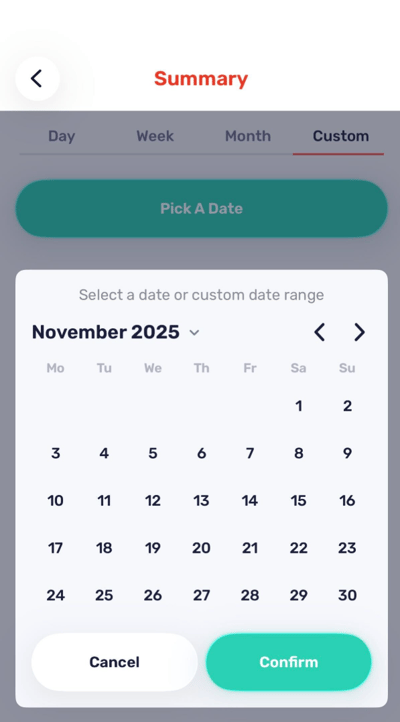
If you wish to customise your date range, tap ‘Pick a date’.
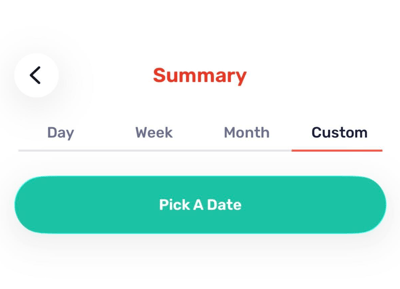
 Select your desired date range and tap ‘Confirm’ to apply it to the graph.